
The infrared spectrum can be classified into three regions: near, mid, and far IR. Fourier-Transform Infrared Spectroscopy (FT-IR) typically uses mid- and far-infrared wavelengths to characterize specific bonds in a material. This method is most commonly used to identify organic and polymeric materials. Near IR is not as commonly found in laboratory and research settings, but has found its place as an extremely useful, low-cost analysis tool in the food industry that requires relatively small amounts of material.
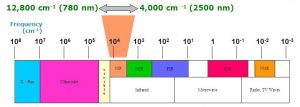
Near IR refers to wavelengths in the range of 780 to 2500 nm, as shown in the figure above. Upon interaction with these waves, chemical bonds between atoms vibrate similarly to the stretching and contracting of a spring. The frequency of these vibrations can be modeled as a function of the mass of the two atoms and the strength of the bond. When the vibrational frequency of the bond matches the radiation frequency, a net transfer of energy occurs and can be plotted as energy vs wavelength, resulting in a characteristic spectrum.
Most molecules in a sample occupy the lowest energy level (level 0), allowing vibrations to be accurately modeled as simple harmonic motion when they transition from level 0 to 1. These transitions manifest mostly in the far IR region, and are what FT-IR machines (such as the Varian 3100 in the MCL) use to identify molecular bonds. In a more realistic model, transitions from level 0 to 2 or 3 are possible and are referred to as overtones. Most overtone frequencies occur in the near IR (NIR) region. Thus, specific bonds exhibit different characteristic group frequencies containing overtones when analyzed with NIR. This extended analysis is not necessary for most research, but has found usefulness in analyzing food products.
Wheat Products
NIR is used around the world to determine protein and moisture content in wheat. Specifically, NIR can determine whether conditioning requirements are met before the wheat is milled into flour. This is especially useful because wheat products are usually priced according to their protein content. NIR analysis also allows for accurate prediction of the quality of the flour including parameters such as flour yield, water absorption, dough development time, extensibility, and loaf volume.
When baking, bread products can lose up toe 20% of their moisture. Monitoring baking bread with NIR maximizes the quality and consistency of the products. (https://onlinelibrary.wiley.com/doi/abs/10.1002/jsfa.2740350116)
Dairy Products
(https://onlinelibrary.wiley.com/doi/10.1002/9780470027318.a1018)
Protein content in milk is also often determined with NIR analysis but holds most useful when producing powdered milk. These powders are analyzed on-line as they are produced to determine and control the moisture content. NIR instruments can also be calibrated for different types of cheeses (specifically cheddar cheese due to the high market demand).
Meat Products
(https://onlinelibrary.wiley.com/doi/10.1002/9780470027318.a1018)
Specialized fiber-optic NIR instruments have been developed to analyze fat content in meat products by spearing a carcass prior to butchering, ensuring high-quality meat products. Cooked meats such as ham, liver sausage, and pepperoni are analyzed with calibrated instruments for protein, fat, and moisture contents before mincing.
Fresh produce
Fruits and vegetables are graded and sorted based on freshness determined by shape, size, and color. Finding non-destructive ways to automatically sort produce for quality control has been a barrier for several years. In addition to optical spectroscopy, freshness in fruits can be measured by their sugar content. Japanese researchers have shown success in creating an automated sorting machine by on-line NIR measurements of sugar content in fruits such as mangos, peaches, melons, and pineapples.