
Grain size is an important feature that can determine strength, ductility, and toughness. It is widely used to characterize geologic and metallic samples. Interestingly, the underlying mathematics enables snow science to use grain size to determine the bond strength of snow crystals and to predict the likelihood of avalanches. Geologic samples are particularly hard to characterize because they are commonly a messy conglomerate of many minerals. The MCL uses a variety of machines in combination to characterize geologic samples effectively and efficiently.
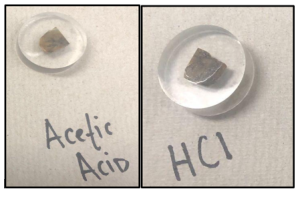
Figure 1: Mounted geologic samples after etching with acid
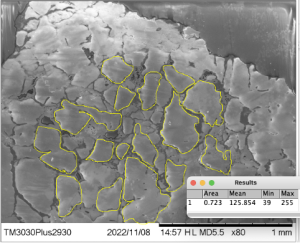
The first step in measuring grain size is to mount the sample in an epoxy resin. In the MCL, this is done using the Buehler SimpliMetII hot mount press. Depending on the size of the geologic sample, the sample may need to be cut into smaller pieces. Since geologic samples have similar hardness to ceramics, it is important to use a diamond-edged saw blade to cut the sample. The surface of each sample should be ground and polished using the LECO Spectrum 1000 auto-polisher. The polishing removes scratches from the surface that may have occurred during cutting. This allows the Hitachi TM3030Plus (SEM) to capture an accurate image of the surface of the geologic sample.
However, it is often difficult to visualize grain boundaries in geologic samples. In this case, chemical etching using acid is used to express the grain boundaries on the sample. Grain boundaries are weaker than the surrounding material, so the acid will preferentially eat along them. One of the challenges of characterizing grain size is choosing the right acid. This depends on the composition of the geologic sample. Hydrochloric acid (HCl) and acetic acid were used in this experiment. Literature has shown that HCl is preferred for calcitic samples while acetic acid is better at etching non-calcitic samples. To compare the differences between the two acids, two geologic samples from the same rock were etched with different acids. These acids are very corrosive and dangerous so it is important to conduct the chemical etching in a fume hood wearing proper protective gear. Chemical etching does not take very long, but to ensure that the grain boundaries were properly exposed, the acid was left on the sample for 2 minutes.
Then load the mounted-etched sample into the SEM. Once an image has been captured, the grain boundaries can be measured using an image processing software, such as ImageJ. ImageJ is free software that utilizes either a desktop or a browser. It uses pixel values to determine a host of different properties of the image. These pixel values will convert into a measurement using the scale on your SEM picture. For this experiment, the contrast threshold can be set to accentuate the grain boundaries. ImageJ has a built-in function that will calculate the average grain size. By clicking ‘Analyze’ then ‘Analyze Particles…’, you can produce an image of where the software observes a grain boundary. ImageJ is not perfect, so adjust the contrast accordingly to give a more complete picture of the sample surface. If this method fails, there is also the option to manually select each grain boundary using the ‘freehand selection’ tool.
As seen in Figure 2, both etchants work, although the grain boundaries are slightly more visible using HCl.
Figure 2: Automatic grain boundary measurements for acetic acid (top) and HCl (bottom) using ImageJ
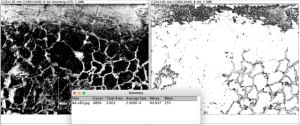
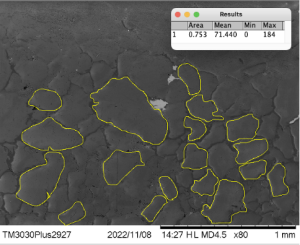
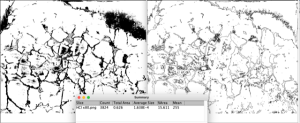 Figure 3: Manual grain boundary selection for HCl (top) and acetic acid (bottom) using ImageJ
Written by Kitsel Lusted