Engineered materials are becoming more complex in attempts to heat increasing needs, such as enhanced physical properties. With that, their characterization is becomes increasingly difficult. Differential scanning calorimetry (DSC) is a thermal analysis technique which tells of various thermal properties of a material such as phase transition temperatures. Many transitions, including evaporation, crystallization, and thermoset cure, are kinetic events meaning they are both time- and temperature-dependent. These kinetic events can pose a problem for thermal characterization; the transition will appear to occur at a higher temperature when heated at an increased rate. As a result, data may appear to support inaccurate transition temperatures. The following equation describes the heat flow signal in DSC experiments:

is the differential heat flow in watts
is the heat capacity of the material (specific heat * mass)
is the heating rate in either °C/min or K/min
is the kinetic heat flow in watts
This linear equation demonstrates that heat flow (left side of the equation) is increased when a higher heating rate is applied (right side of the equation), due to the heat capacity of the sample.
Some hypotheses suggest that the temperature lag and transition temperature shifts may be caused primarily due to the materials’ intrinsic properties. Others speculate that transition shifts have more to do with the measurement mode, namely heating rate and sample mass. The latter supposes that there must be an optimal, universal heating rate and sample mass for the most reliable DSC results.
One effective way to attempt to gain reliable DSC data for a given material is by performing DSC analysis at a variety of sample masses and heating rates. By comparing that data to industry standards or reference data, a “correct” heating rate and sample mass may be found.
There is a trade-off to be made when varying heating rate and sample mass. For slower heating rates, data resolution (e.g. accuracy of temperatures reported) is increased, but the sensitivity (e.g. the sharpness of the peaks) of the heat measurement is lower, especially for smaller sample masses. For higher heating rates, resolution is lost, but sensitivity is increased. The increase in heat sensitivity with increase heating rate and sample mass is caused by the larger heat flow into the sample as compared with the regular background noise. Additionally, melting enthalpy (

No matter the sample mass or the heating rate, internal temperature gradients may form within the sample. A thermal gradient means that the temperature is not uniform throughout the whole sample. In the NETZSCH DSC, owned by the MCL, the heat and the heat flow sensor are both situated at the bottom of the pan. This means that the machine reports that temperature and heat flow, regardless of the actual, average temperature in the middle or at the top of the sample. The result is a lag between the thermocouple reading and the sample’s reaction, making the instrument response appear delayed.
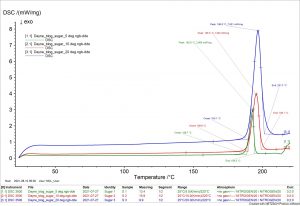
To demonstrate this, table sugar was analyzed in the NETZSCH DSC in the Materials Characterization Lab. For this brief experiement, a sample was tested at 5, 10, and 20 K/min. The data collected shows that the temperature lag from thermal gradients is higher with higher heating rates. Reportedly, household table sugar has a melting temperature of 186°C; the results strayed more and more from that value with higher heating rates, indicating that slower heating minimizes error in the resolution of the data.