
Surfaces vary in multiple ways. For example, surface pores can vary by size, depth, and location. Various techniques exist that analyze the surface of a material, most of which rely heavily on the understanding of the existence of micro an mesopores. Micropores typically have a size of 20 Å, while mesopores typically range from 20 Å to 500 Å. While mesopores are significantly larger than micropores, they are nonetheless important in understanding the full capabilities of the t-plot method, which can determine the surface area and pore volume of a sample.
The Micromeritics 3Flex is capable of performing tests using the t-plot method. Gaseous nitrogen adsorbs onto the surface of a sample at liquid nitrogen temperatures, and the 3Flex measures the adsorption uptake at various pressures. From this process, a graph is produced, called an isotherm, that can be analyzed to understand pore volume and surface area. For the t-plot method, this is accomplished by comparing a reference adsorption isotherm of a nonporous material having the same surface chemistry.
In the t-plot method, a t-curve is plotted which graphs the average thickness of the adsorbed layer on the surface.

is the adsorption isotherm of a given gas on a flat surface having a specific surface area in &latex \frac{m^2}{g}$. The units of this are mol/gram
is the pressure at which the adsorbed phase has an average density equal to its liquid density
The equation converts
In order to achieve a t-plot, the average film thickness is then converted to volume adsorbed using the following formula:

is the volume adsorbed at a given pressure
is the maximum adsorbed amount
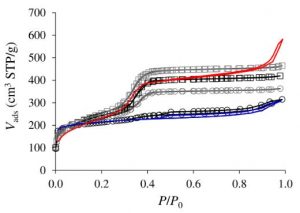
Upon calculation, the value for the volume adsorbed is plotted against each pressure point. Once the t-plot is achieved, surface analysis can be performed using the graph that is produced. An example t-plot can be seen in the following figure:
If the t-plot is a straight line, the sample has the same adsorption behavior as the flat surface meaning the sample contains no pores. In order to analyze a non-flat line, the first segment of the graph is attributed to adsorption due to pore filling, and the second segment is attributed to the adsorption of the external surface.
While this method has been proven to be accurate for microporous surfaces, the method is less accurate for mesoporous materials. The calculations above assume that the thickness of the adsorbed layer is not independent of the pore diameter. With mesopores, the thickness is independent of the pore diameter, so the formula may fail.
For further reading, consider https://pubs.acs.org/doi/abs/10.1021/la5026679